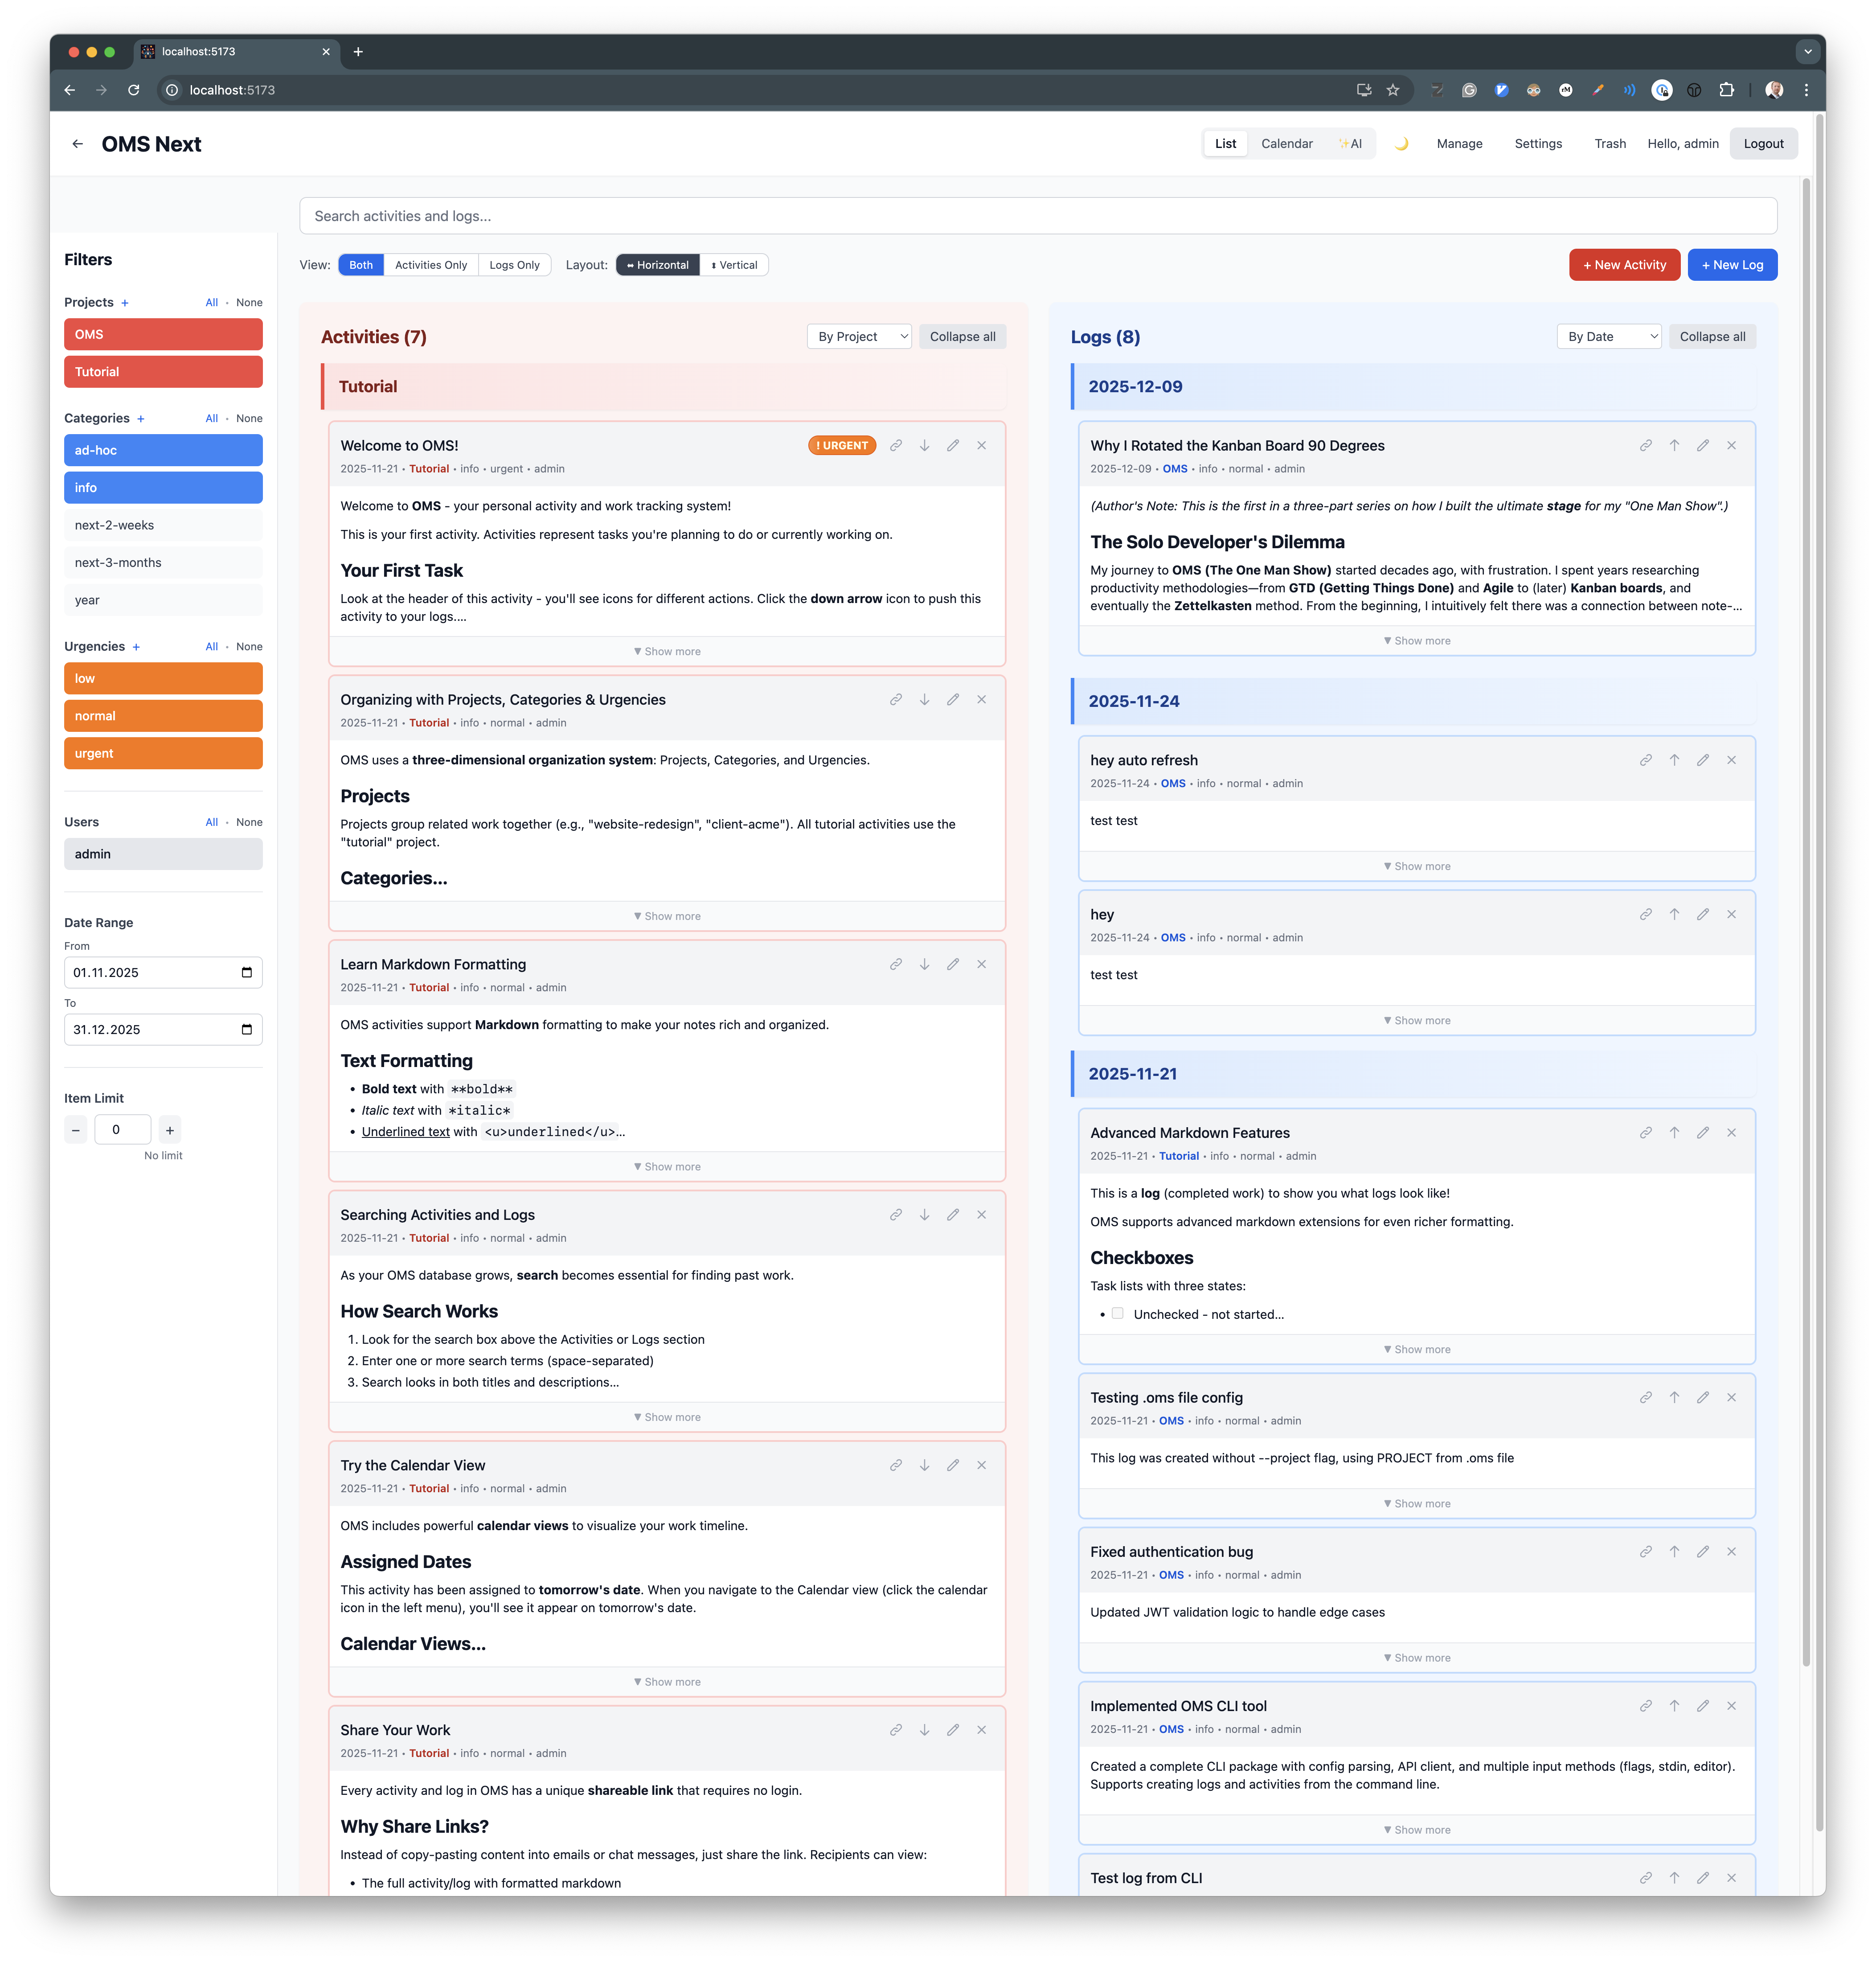
Why I Rotated the Kanban Board 90 Degrees
(Author’s Note: This is the first in a three-part series on how I built the ultimate stage for my “One Man Show”—a journey from Kanban boards to a Virtual CFO and strategic business advisor)
The Solo Developer’s Dilemma
My journey to OMS (The One Man Show) started over twenty years ago, with frustration. I spent years researching productivity methodologies—from GTD (Getting Things Done) and Agile to (later) Kanban boards, and eventually the Zettelkasten method. From the beginning, I intuitively felt there was a connection between note-taking, journaling, project management, and decision-making, but I couldn’t quite figure out how to best combine them. Mind you, this was at a time when neither Git nor GitHub even exist yet.
I had a specific problem: I was interested in “too many things.” I was juggling private passion projects, open-source projects, and client work simultaneously. Context switching was killing me.
I realized that most project management tools were lying to me. Most modern ones are built on a fundamental assumption: that I am a factory.
Modern tools assume the user is a worker on an assembly line. We pick up a “ticket,” move it to “In Progress,” and eventually to “Done.” This works beautifully for teams where hand-offs are necessary and roles are specialized.
But I am not an assembly line. I am a jazz musician. I am constantly improvising.
I realized I didn’t want to manage “Tickets”—heavy objects that hide their content behind a click. I wanted to manage a stream of thoughts.
I envisioned a task not as a card to be moved, but as a content block—like a short email or a journal entry. It needed to capture the nuance—the bullet points, the open questions, the context—right there on the surface. I didn’t want to “open” a task; I wanted to just read it, edit it, and act on it.
My goal was to speed up “reloading context.” Often, I would have to dive deep into “Just One Thing” for days—being effectively “under water”—and lose track of everything else waiting for me on the surface. When I resurfaced, I needed to be brought back up to speed with where I had left off before diving in.
I went back to first principles. I didn’t need a better way to organize; I needed a better way to orient.
Evolution from PyQt to the Web
I didn’t just dream this up yesterday. Exactly two decades ago, in 2005, I built a basic prototype using Python 2.4 (!!!) with PyQt3 and Web Views—a concept that weirdly anticipated QML. I loved it. It was fast, local, and exactly what I needed. Yet, a bit rough around the edges 😊.
I ported it to Python 3 and PyQt5 to create some screenshots for nostalgia.
Here, we can already see the distinction between Actions (“planned” activities) and the Log. I’ll get to that later:
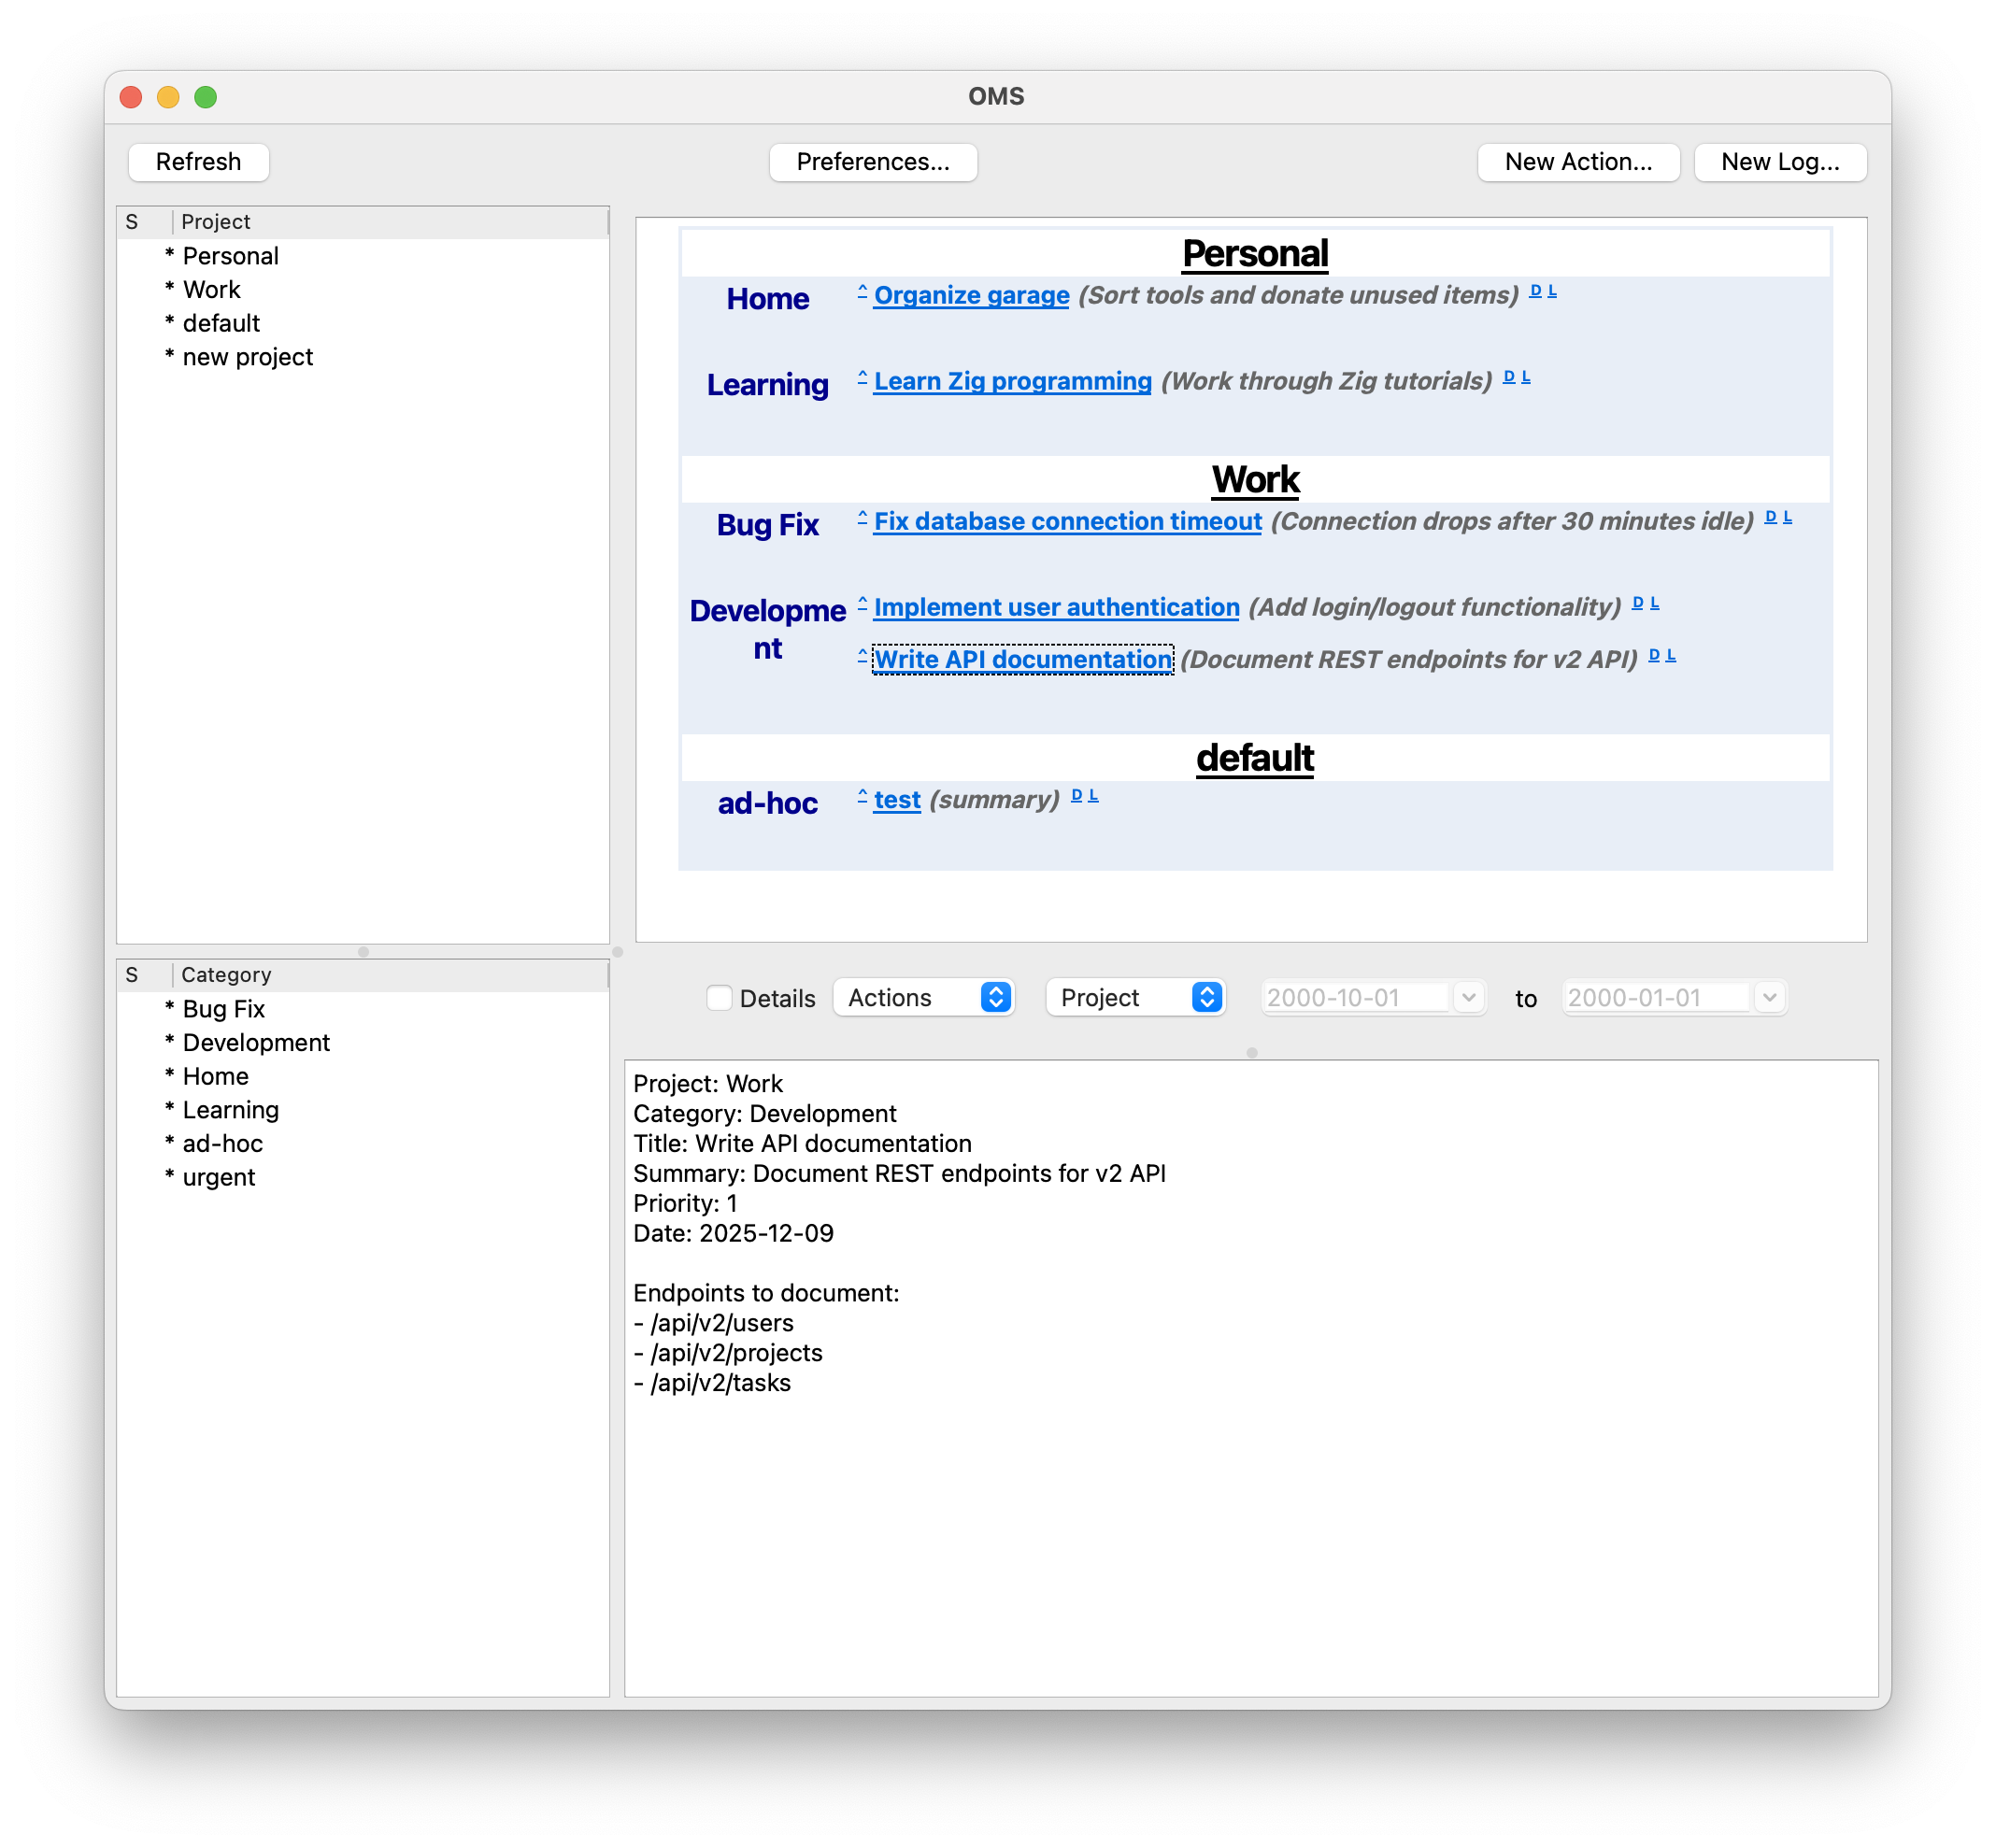
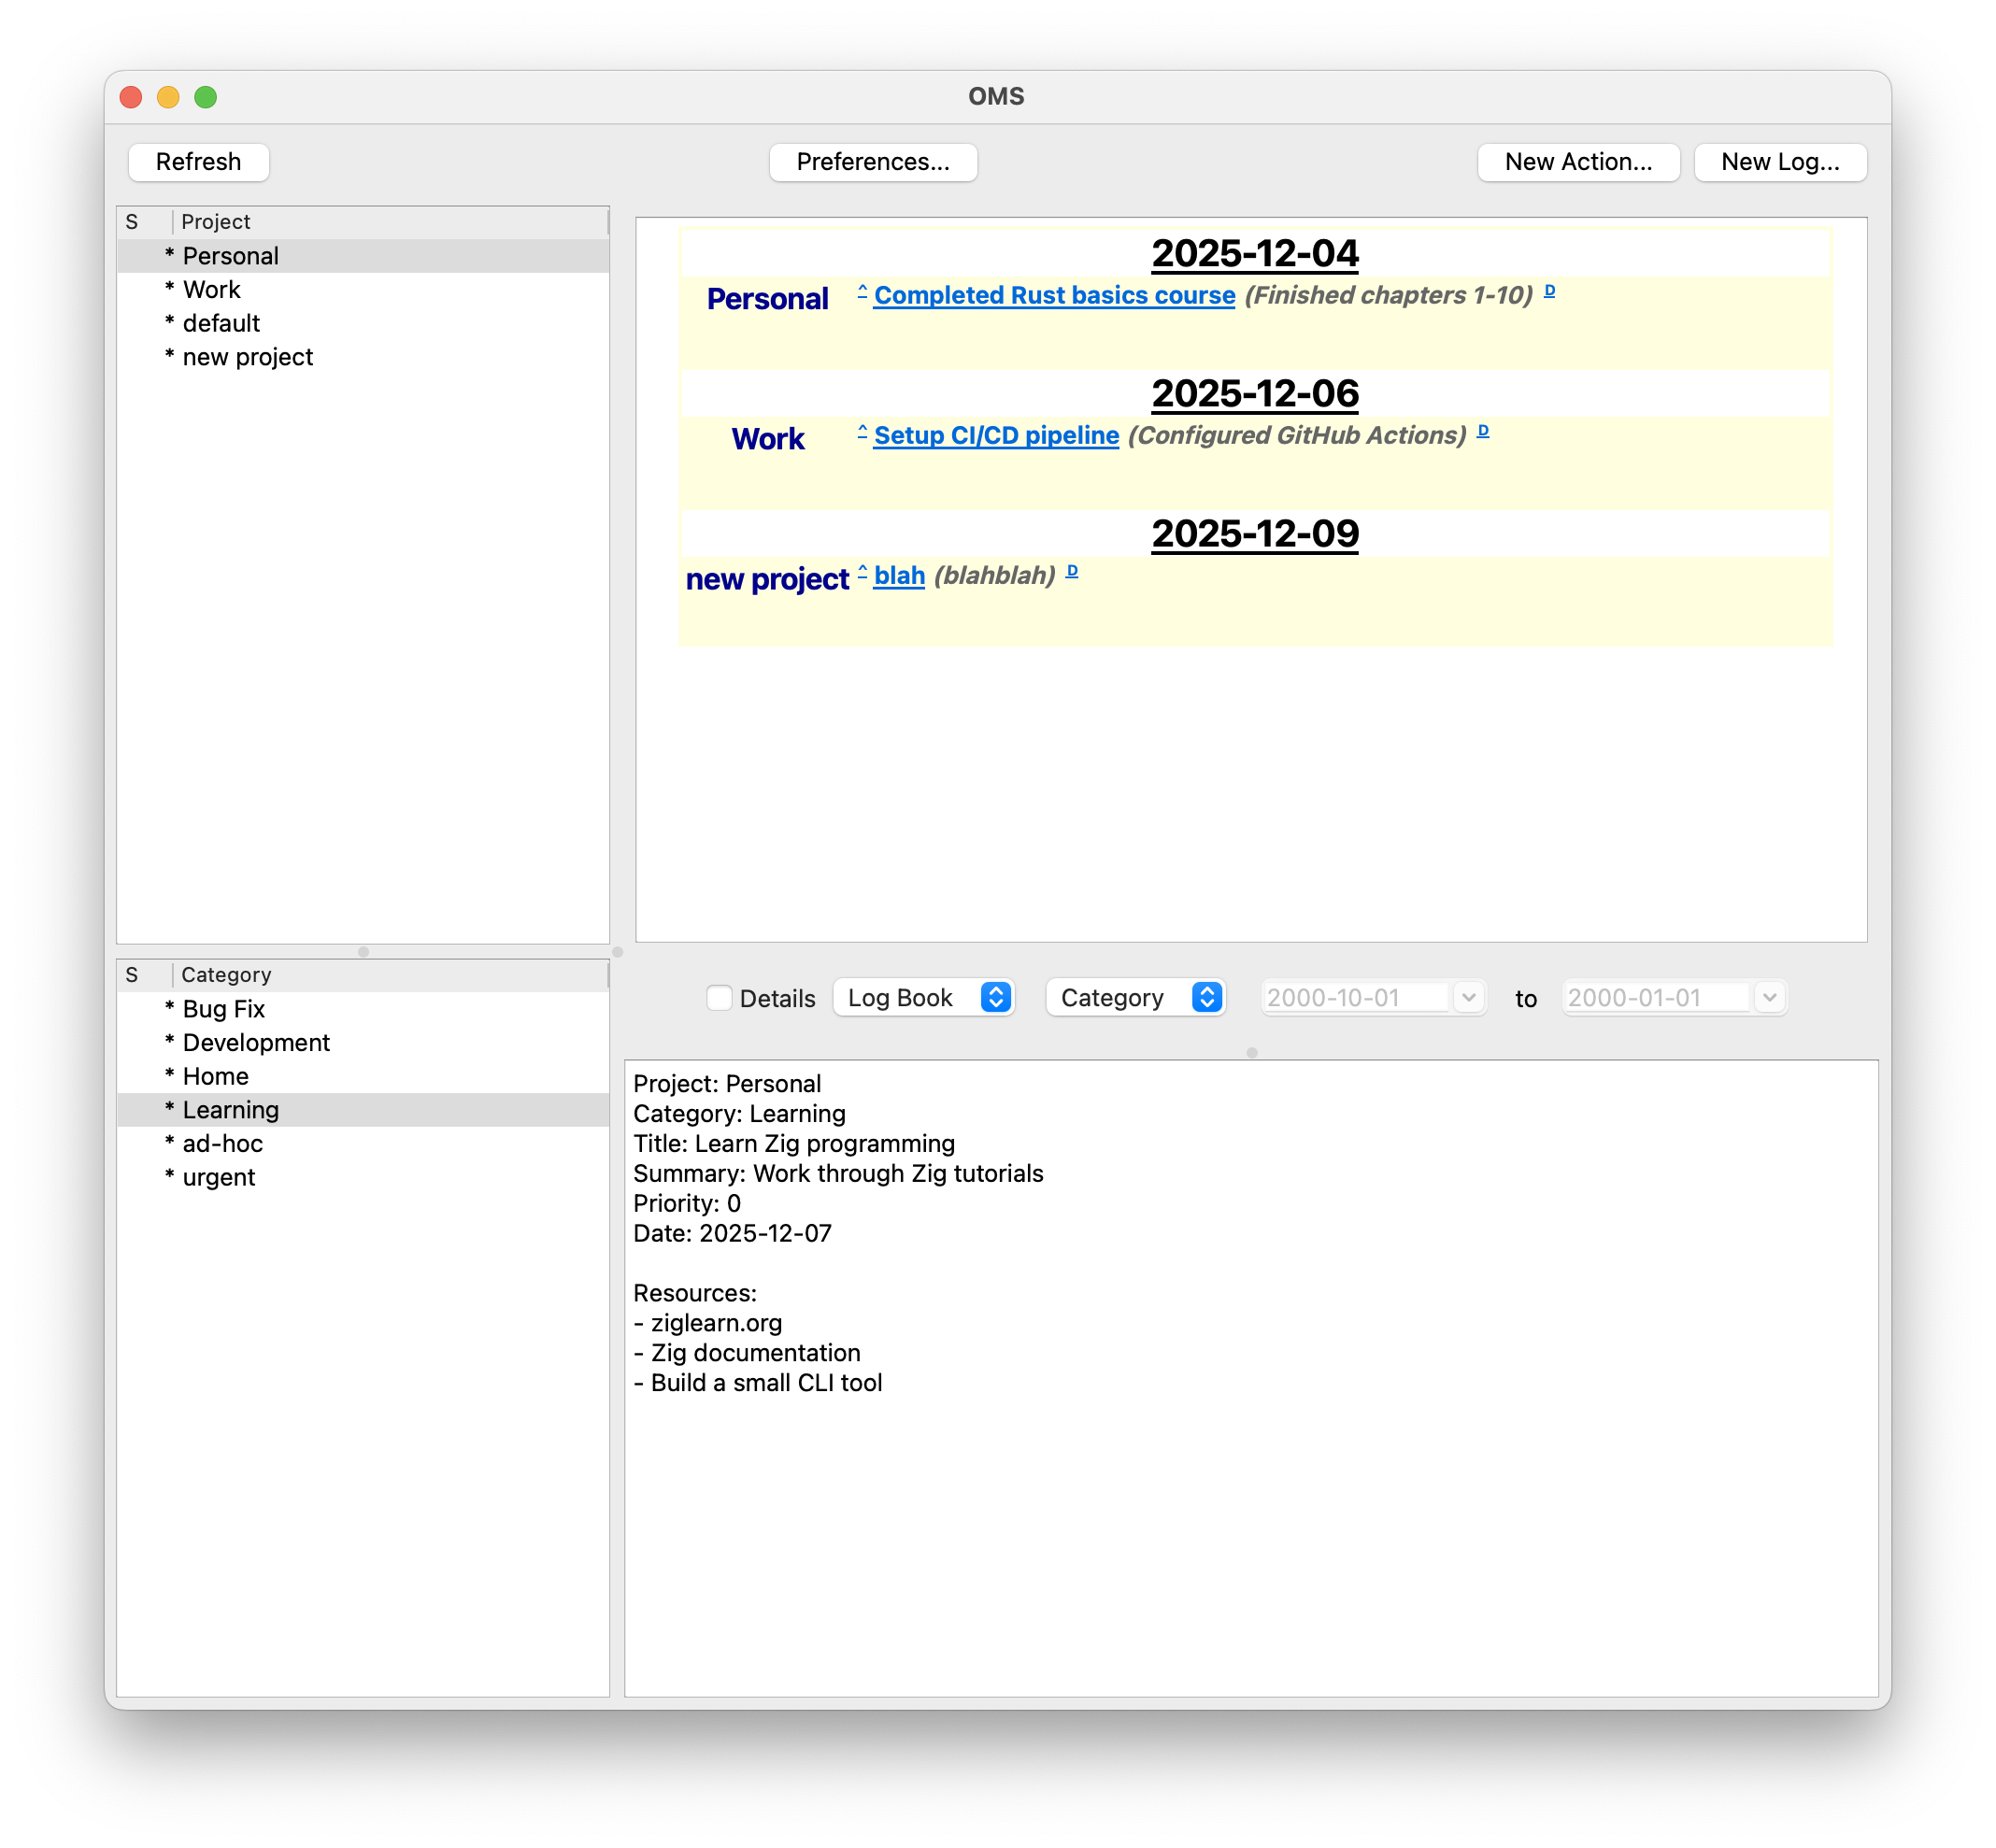
I could quickly toggle on and off projects, categories, and showing detail text inline versus in the bottom split for just the selected item.
But it had a fatal flaw: Sync. I couldn’t use it on my work computer and my home computer without friction. When the tool’s whole point is helping me juggle work life and private life, having to maintain two separate instances of it was bad. Keeping the data files in sync was a burden. Eventually, I stopped using it, but I never stopped missing it.
Years later, I made another attempt: Web-Based. Boom! Work computer, home computer—no problem. I kept the soul of the PyQt prototype and solved the sync problem via a central server. It also was my first experiment with HTMX. It worked nicely, but the complexity of managing out-of-band updates eventually became a maintenance nightmare.
This fall, I decided enough was enough. I initiated a complete rewrite—OMS Next which fixed the bugs that had annoyed me for years.
Concept: Lenses, Not Boards
Standard tools insist on organizing work by folder, project, or list. The theory goes that I should have a “Marketing” board for campaigns and a separate “Dev” board for code. But this approach breaks down at scale. If I have fifteen active projects, maintaining fifteen separate lists is a full-time job in itself. Furthermore, my brain doesn’t work in those silos. A marketing task—like writing a blog post—is often blocked by a dev task—finishing a feature or fixing the UI to make for a nice screenshot. Separating them hides the reality that they are part of the same immediate urgency.
I rejected the rigid folder structure in favor of 3-Dimensional Lenses. Every item exists at the intersection of a Project (the broad scope), a Category (the context, like deep-work or ad-hoc firefighting), and an Urgency.
Typical Categories I use: “ad-hoc”, “next 2 weeks”, “info”, plus a few more for longer-term items.
Typical Urgencies I use: “low”, “normal”, “urgent”.
This system allows me to shift mental states using Peripheral Vision vs. Laser Focus.
During my fictional morning review, I can turn on all lenses to see the entire landscape of my business—a true peripheral view. But when it’s time to code, I click api-rewrite plus urgent. Instantly, the clutter vanishes. The fifty other tasks on the plate disappear. I am not distracted by the “Marketing” task because it literally isn’t there. I achieve laser focus without leaving the tool.
Sidebar: The Power of Peripheral Vision
In the physical world, we rarely work in isolation. Think of a bookshelf filled with your most fascinating and inspiring books. You don’t read them every time you walk past, but just seeing the spines triggers micro-associations. They remind you of ideas, goals, and unfinished thoughts.
The same applies to a whiteboard behind your monitor or a pile of Post-its on your desk. Even when you don’t focus on them, they exist in your peripheral vision.
Standard software breaks this. It hides everything in folders or behind tags, forcing you to maintain “Object Permanence” with your own brain power. You have to expend energy just to remember that a project exists.
I wanted OMS to mimic the bookshelf. By keeping projects visible in the margins via Lenses, I can keep things “at the back of my head” without effort. They become part of my thinking context, waiting to be modulated by attention. I might be coding an API, but seeing the “Marketing” tag in my periphery reminds me to write cleaner variable names for the screenshots I’ll need later.
Philosophy: Our Past is Our Asset
In almost every productivity app I tried, “Done” was a graveyard. I checked the box, the task disappeared, and it was archived into oblivion. For a solo business, this is a disaster. If I forget how I fixed that Nginx SSL error three months ago, the business has forgotten.
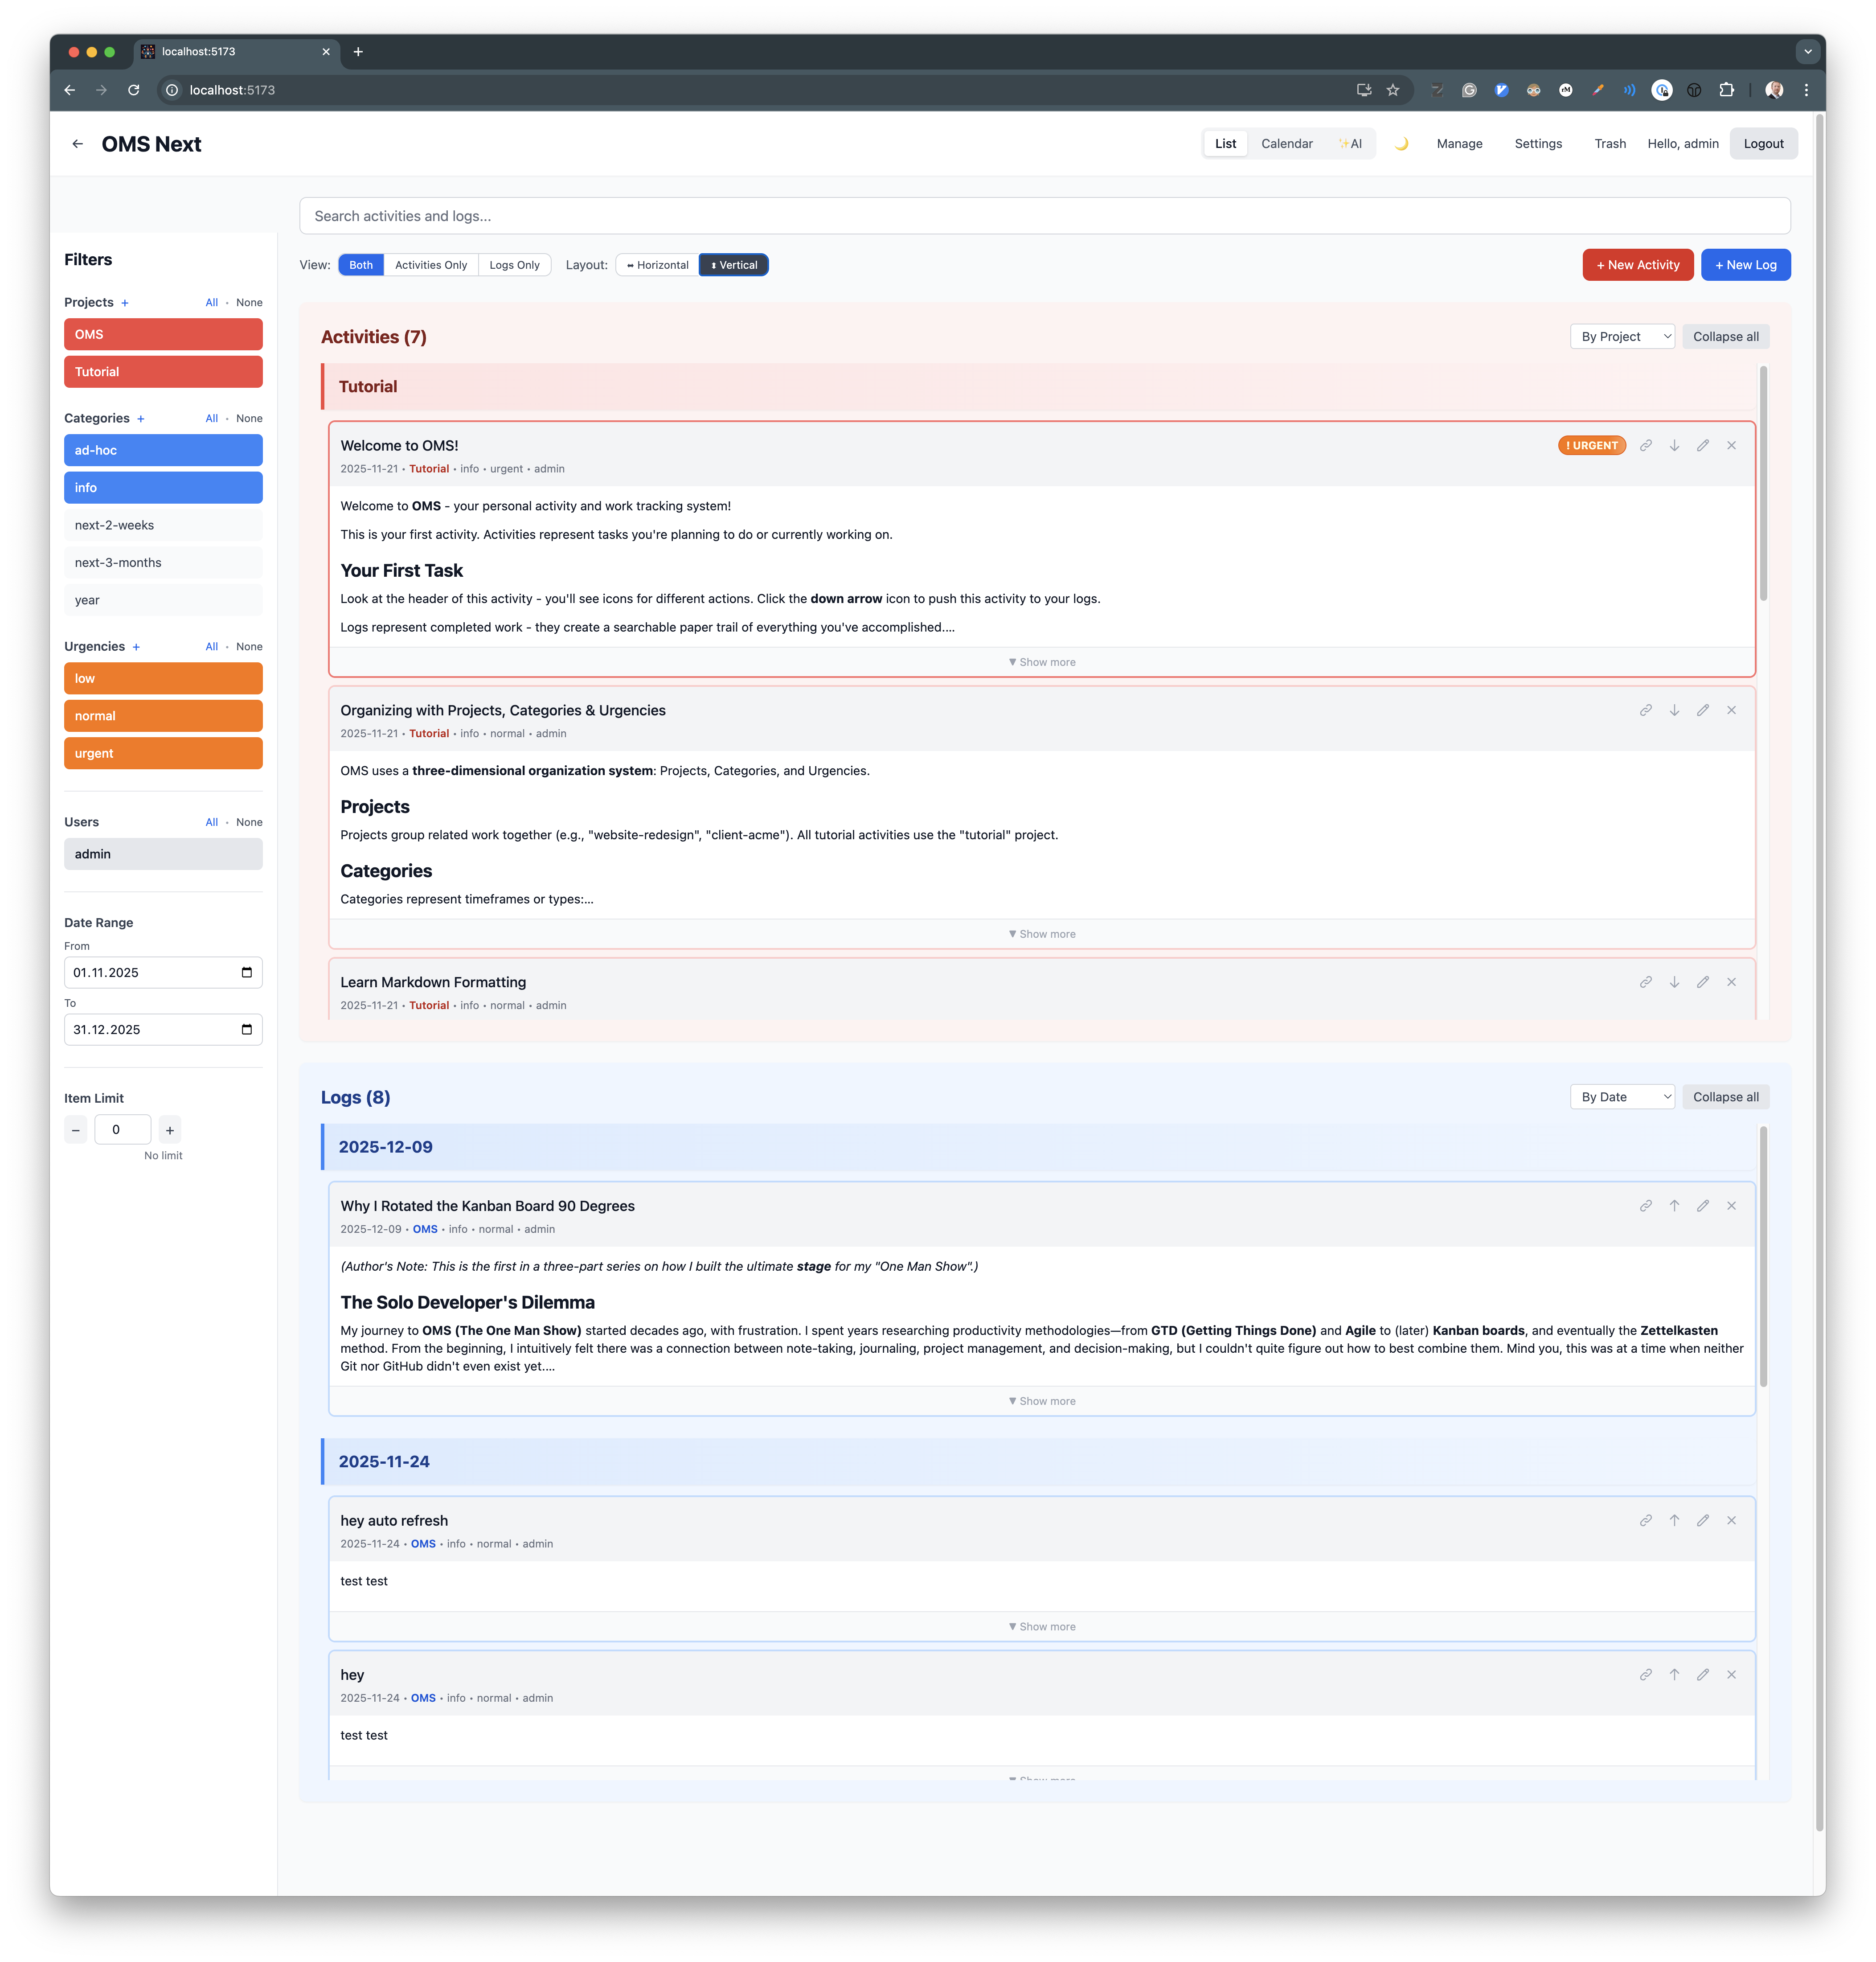
I introduced the Activity ↔ Log philosophy. An “Activity” is work to do, and a “Log” is work done. In my system, they are the exact same object, distinguished only by a state toggle. When I finish a task, I don’t archive it. I Log It. It becomes a permanent, searchable part of my Work Journal.
This where the 90-degree rotation from the title comes from.
In a standard Kanban tool, you drag a card sideways from “Doing” to “Done.” That is horizontal friction. It implies the work has moved to a different station on the factory floor.
In OMS, I rotated that flow. Activities sit vertically on top of Logs. When I finish a task, I hit the down arrow (or click “Push to Log”), and it drops into the history below. I use gravity instead of friction. It feels faster because it is faster.
This concept acknowledges that the development process is messy. Did I mark a bug fixed, only to find it broke in production ten minutes later? In other tools, I would have to find the closed ticket, re-open it, and add a comment. In OMS, I simply click “Pull to Activity.” It respects that “Done” is fluid, removing the friction of state changes so I can keep moving.
On wide screens, it’s no shame to rotate back 90 degrees 😊:
Built for Speed: A Developer-Native Workflow
My “One Man Show” cannot afford friction. Every second I spend clicking through UI layers is a second I am not building. I demanded that the tool feel like an extension of my thought process.
I chose Markdown as the native format. It is portable, developer-friendly, and handles code snippets beautifully. If I need a visual, I simply paste a screenshot from my clipboard, and it uploads instantly.
Crucially, this data is not siloed. Every Activity and Log has a unique, public share link. If I finish a complex piece of ad-hoc research, I don’t need to waste time reformatting it into a report or an email. The card is already structured and beautiful—I just send the URL. And if I ever need to bring someone onto the stage properly, the system supports full multi-user collaboration (a legacy of my earlier “Dreamteam” experiments).
Visually, OMS uses cards, but functionally, it flips the standard model on its head. In most tools, a card is a container for metadata—you see a title and a tag, but the actual work is hidden behind a click. In OMS, the card is the content. The Markdown body is rendered directly on the board.
While massive entries are truncated to keep the view tidy, the default state is visibility. I can scan the substance of my backlog—the nuances, the questions, the code snippets—without diving into a single modal.
Perhaps most importantly, I built a CLI not as an afterthought, but as a primary input method.
I can simply type oms log "Fixed the auth middleware race condition" -p backend -c ad-hoc directly into the terminal. I capture the thought, tag the context, and log the history without my hands ever leaving the keyboard; similar to source code commits—but for the entire show, not just the software. In the next article, I’m going to take this concept much further.
A Mobile Command Center
But genius doesn’t always strike at the keyboard. Sometimes it strikes while walking the dog or waiting for coffee.
I built OMS as a Progressive Web App (PWA) that lives on my phone’s home screen. It’s not a stripped-down companion app; it’s the full system. Despite having learned to hate so many aspects of browser-based software, especially with a systems programming background, I’ve always admired this aspect of the web. It’s the ultimate software distribution channel: all you need is a tiny, human-readable, easy to memoize link. You type it into a browser, and boom! You can run cool software.
If I remember a task I forgot to log, I pull out my phone and “Push to Log” in seconds. If I have a breakthrough idea for the api-rewrite, I create an Activity right there. I can even chat with the AI on the go to unblock my thinking or get a quick summary of my day (more on that later). The system captures everything, not just what happens in the office.
Observing Reality
In OMS, consistency is key. Both Activities and Logs share the same powerful organization: I can group either of them by Project, Category, or Urgency. Within those groups, everything is automatically sorted by timestamp.
By default, however, they serve different masters. Activities are grouped by Project (so I can see the scope of work), while Logs are grouped by Date. This gives me a linear view of the world—a simple timeline flowing backward from today.
This is perfect for execution. I can use the Lenses to toggle on exactly the mix of projects and urgencies I want to see. But even with that precise filtering, the view remains linear. I also wanted a bird’s eye view helping to understand the patterns of my work, seeing the density of what I created versus what I actually finished over time.
I concluded that the most natural visualization—the one that transmits temporal data straight from retina to neuron—is the time-tested calendar grid.
But I rejected the standard “Planner” philosophy.
I didn’t need another scheduler. I already have apps that handle the “hard landscape” of meetings and appointments perfectly. I don’t need the 500th tool to ping me about a deadline or clutter my device with redundant notifications.
Standard project tools often try to replicate this behavior. They treat the calendar as a Projection, asserting “You will do X on Tuesday at 2 PM.” But while meetings are fixed, deep work is fragile. Tuesday at 2 PM is inevitably when the server crashes.
I built the OMS Calendar as an Observer. It focuses less on scheduling and more on visualizing. It maps my Logs (what I actually did) against my Assigned Dates (soft nudges for the future).
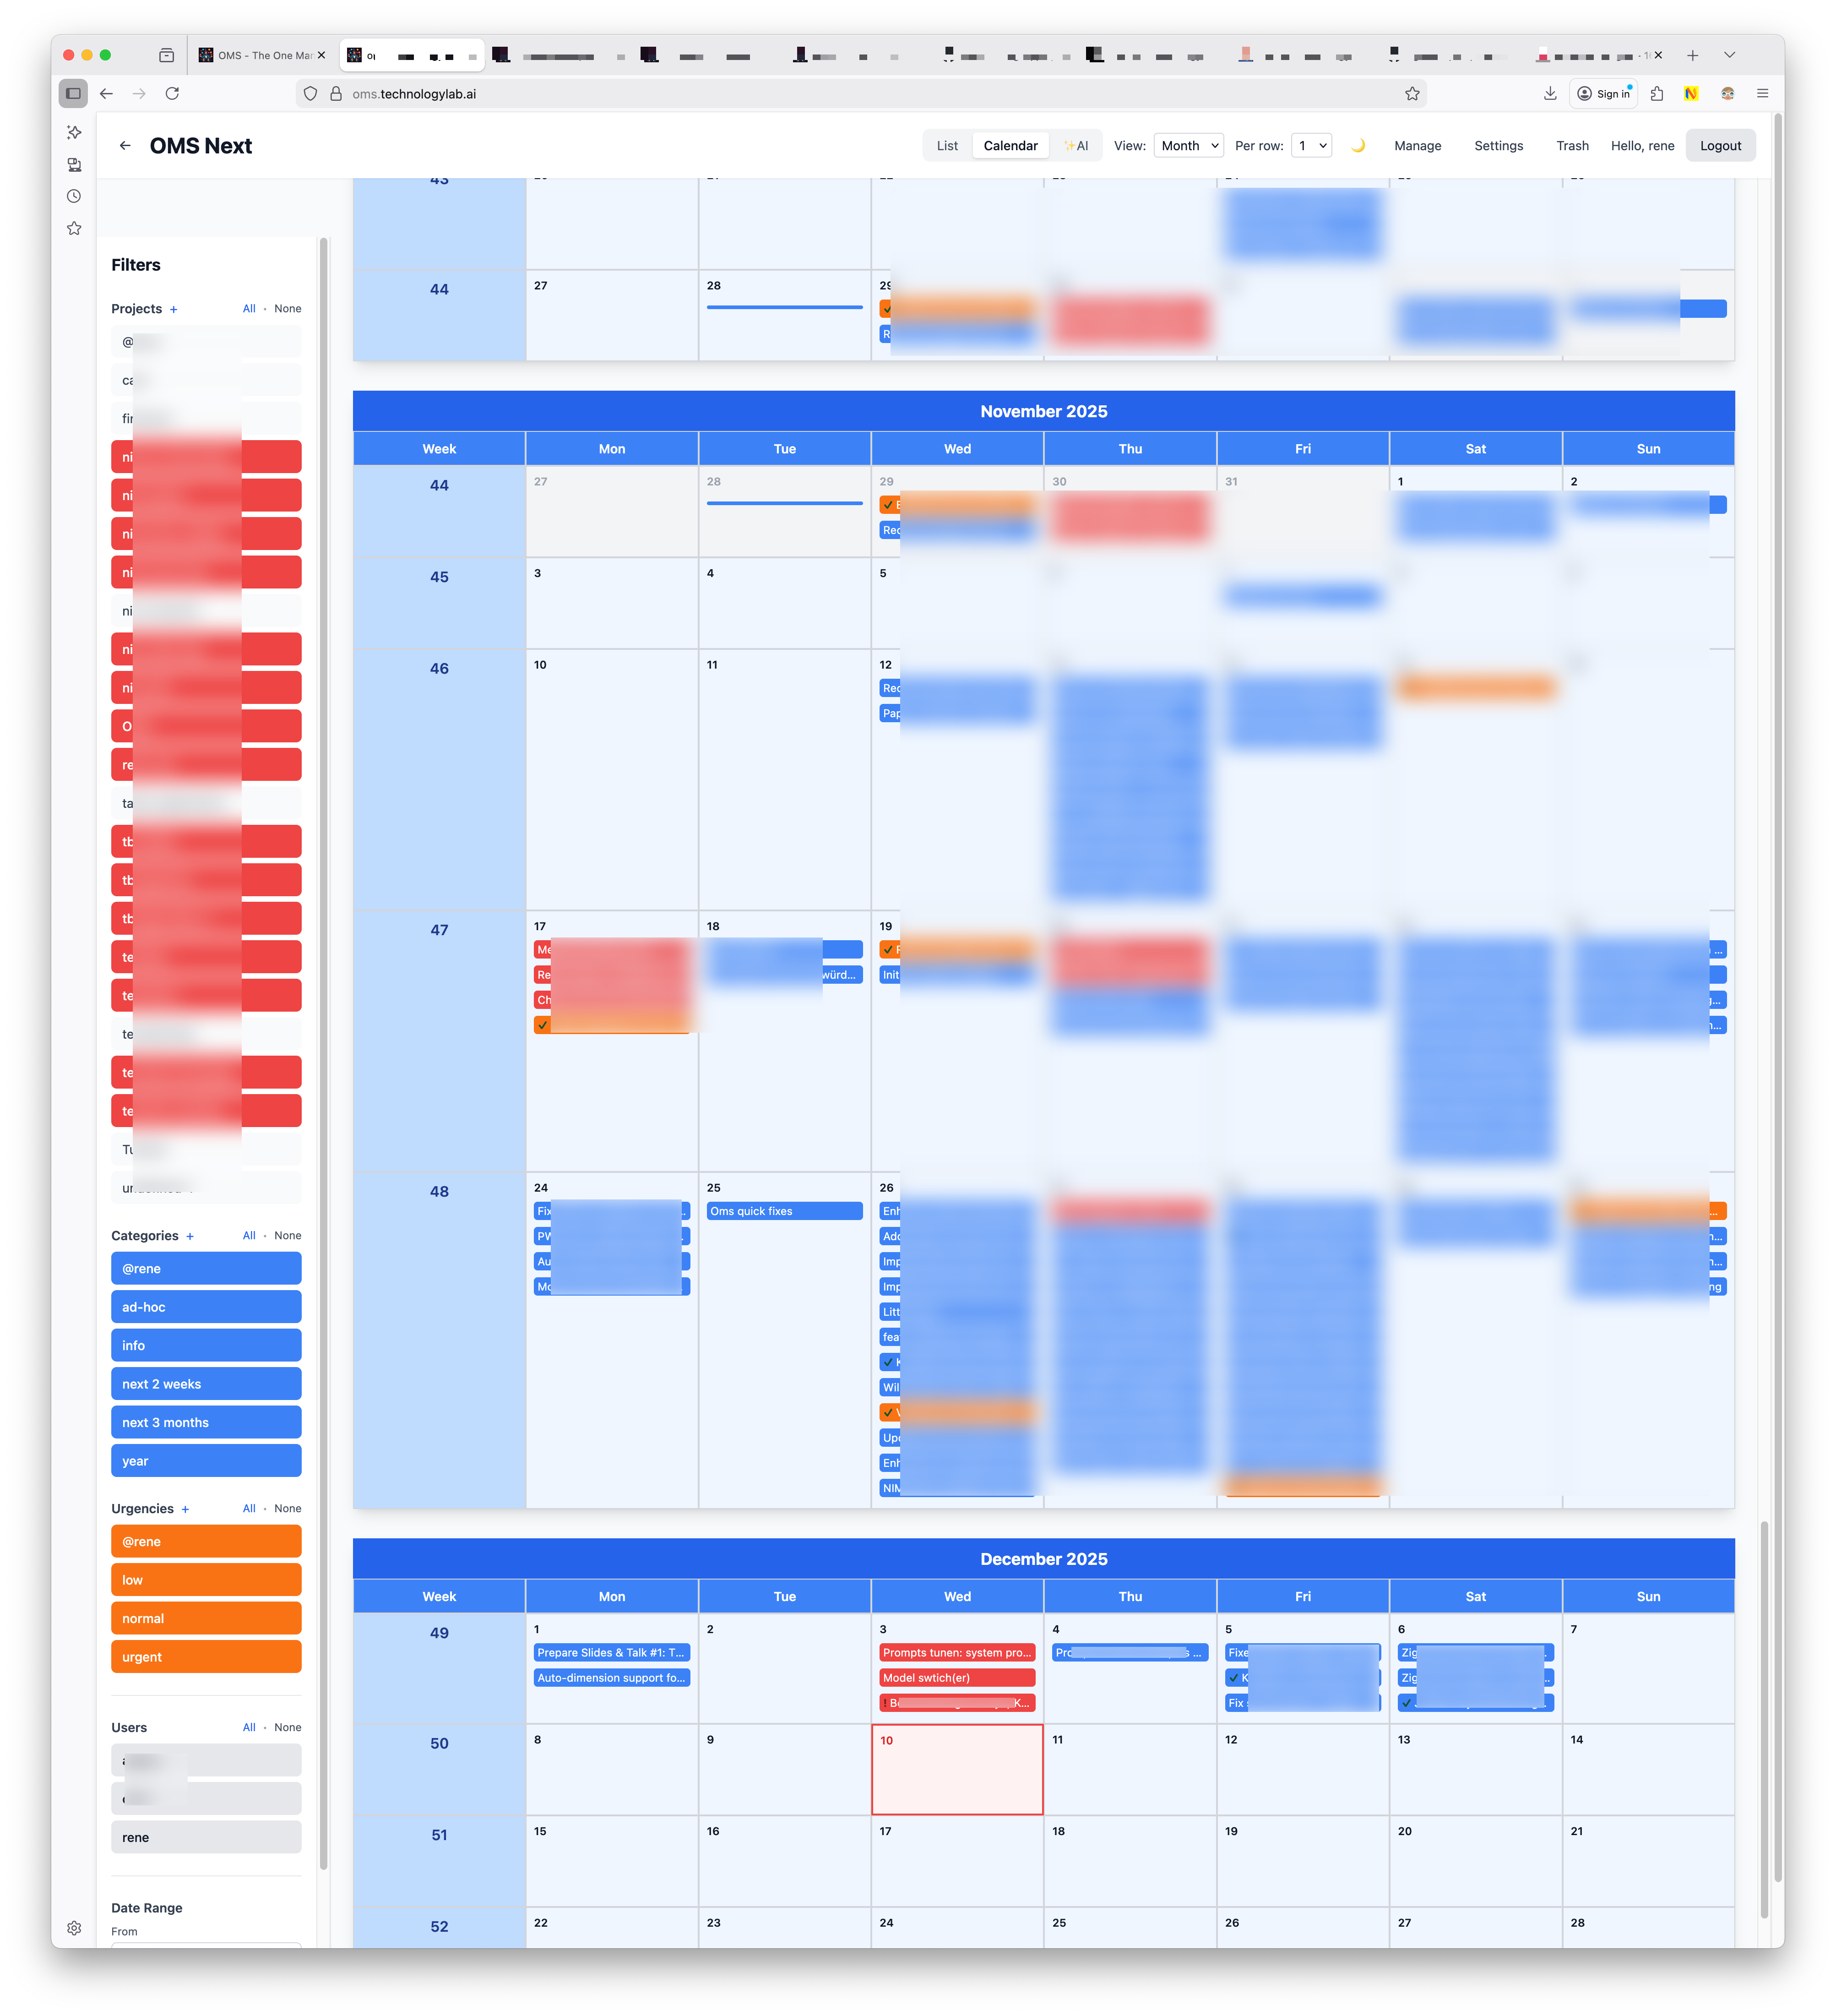
This creates a Heat Map of Reality.
At a glance, I see the Red activities incoming (the pressure), the Orange markers (for the rare things with an assigned date), and the Blue logs (the output).
It answers the persistent question: “Where did all that time go?”
The answer is right there, rendered in pixels. It turns out the time didn’t vanish; it just changed color. The map visualizes exactly how I spent the week converting Red “urgencies” into Blue history.
Conclusion: The Stage for Improvisation
I didn’t build OMS to compete with enterprise tools. I built it to replace the chaotic mix of tools that was killing my rhythm—the sticky notes, the mental checklists, and the cognitive drag of constantly reloading context.
If I am the jazz musician, this is my Rhythm Section. It keeps the beat while I improvise. It captures the “To-Do” notes so I can focus on the melody, and it logs the history so I never lose the recording. It turns the chaos of the One Man Show into a performance.
In Part 2, I’ll take this further. I’ll show how having a complete “recording” of the performance allowed me to plug in an AI Brain. Since it has access to the full script, it actually understands my business context—transforming the system from a passive journal into an active partner that helps me decide what to do next.